System diagnosis tools: Monitoring & Disturbance
A set of extra diagnosis modules have been implemented into Summit devices to extend the already available tools from the field network protocols themselves (EtherCAT and CANopen). When the update rate of the field networks is not fast enough to analyze system transients is when these tools are useful.
- Monitoring. Transfer data from the drive to the main device. It is used to obtain deterministic and precise information from the device measurement helping to identify the system bandwidth, transient behaviors or any other system parameters.
- Disturbance. Transfer data from the main device to drive. It is used to inject signals into the system in a deterministic way.
The principle of operation of monitoring and disturbance is to use the internal drive sampling rate to fill/clear an internal buffer. The content of this buffer is managed by the main device using a single transmission of big frames.
For products based on the EVE family, monitoring and disturbance are only available through Ethernet-based communications (Ethernet in CANopen FW and EoE in EtherCAT FW).
Whereas EtherCAT and CANopen protocols reach high update rates and deterministic transmissions with very low latency sacrificing the amount of information that can be transmitted on every packet, monitoring and disturbance sacrifice the latency and the high update rates to be able to transmit the big amount of information on every packet. This allows accumulating internal drive samples until this buffer is filled and then transmitted in a single transmission. During this transmission, the drive will keep filling the buffer for the next transmission.
The monitoring and disturbance registers are located in the subnode 0. The complete list of registers and all its detailed information can be found in section Monitoring-Disturbance Registers (Mon-dist registers subnode 0 or Mon-dist registers EtherCAT & CANopen).
Monitoring
The purpose of the monitoring is to get a short time scope with data at a high update rate.
The module offers the possibility of capturing data before the trigger event. The data buffer before the trigger event is defined as a circular buffer, which means that if new data is received before the trigger event occurs, older data will be removed. The size of this stage is defined with register monitoring delay. Then, after the trigger occurs, the data acquisition is finished until the total configured size is filled, defined with monitoring buffer size.
The output of the monitoring process is a monitoring data that can be read.
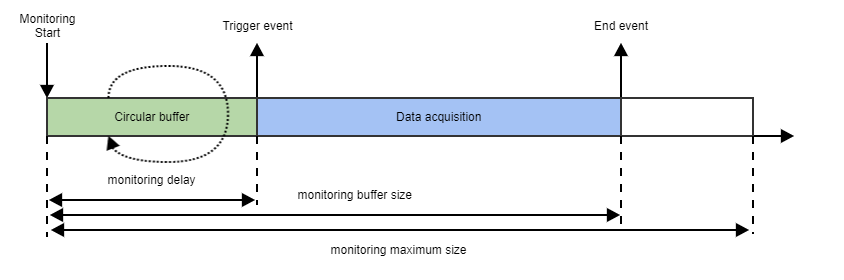
Monitoring maximum size is product dependent.
When computing monitoring buffer size, the maximum number of samples will depend on monitoring maximum size, the number of monitoring channels and the size of each channel:
Control and status
The monitoring states are:
| Monitoring states |
|---|
| Init stage |
| Filling delay data |
| Waiting for trigger |
| Data acquisition |
| End stage |
Monitoring workflow can be controlled with the following registers:
Enable monitoring: Enables and disables monitoring.
- Monitoring status: This register allows knowing the monitoring status, which contains information about:
- If the monitoring is actually enabled.
- The state of the monitoring process.
- Other useful information
Sampling time
Monitoring module is executed at the same rate of the position and velocity control loops. The monitoring sampling frequency is adjusted with the monitoring frequency divider register. This register is a divisor of the position and velocity loop rate (like a prescaler), and this base frequency can be read with the position & velocity loop rate register.
Example
The selected power stage frequency makes that the position & velocity loop rate register contains value 20000 (20 kHz).
A monitoring frequency divider = 5 will generate a monitoring sampling rate of: 20 kHz / 5 = 4 kHz.
The stability of the position & velocity control loops reference is not guaranteed for all the products. For products based on the EVE family and dual-core Summit architecture, the inter-processor communications may not be fast enough to store all the mapped monitoring variables in 1 cycle.
Triggers
The are several trigger types:
| Triggers | Description |
|---|---|
Auto trigger (no trigger) | This condition is always accomplished |
| Forced trigger | External event received from communications |
| Rising edge | When the register configured as trigger signal exceeds the defined threshold |
| Falling edge | When the register configured as trigger signal goes below the defined threshold |
| Rising or falling edge | When the register configured as trigger signal crosses the defined threshold |
Desired channels - mapping process
Monitoring tool needs to know which channels have to be captured. This is set in the mapping before starting the process.
Not all registers can be mapped, only the registers PDO mappable can be used.
The monitoring mapping process is very similar to the PDO mapping used in the industrial fieldbuses like CANopen or EtherCAT.
The mapping process is:
- Monitoring has to be disabled in order to modify the mapping.
Registers monitoring mapped register N contain the mapped register at the position N (between 0 and 15).
The channels have to start at position 0 and they have to be contiguous.
The codification of the mapping is as follows:Bit 31..28 27 26..16 15..12 11..8 7..0 Meaning Subnode Reserved Register address Reserved Data type Size (bytes) The available data types are:
Data type Value UINT8 0 INT8 1 UINT16 2 INT16 3 UINT32 4 INT32 5 UINT64 6 INT64 7 FLOAT32 8 FLOAT64 9
Register monitoring number mapped registers specifies the number of used channels.
Example
If the number of mapped registers is set to 6, then mapped registers from 0 to 5 must contain valid registers.
- Finally start the monitoring.
Any error, such an invalid mapping, will prevent the monitoring to start and it will be reported in monitoring status register.
There are several registers that can be useful to perform extra checks in the application, like register monitoring number of bytes per sample, which contains the size in bytes of all the channels mapped in each sample.
The maximum registers mapped can be 16 (16 channels at the same time).
Monitoring example
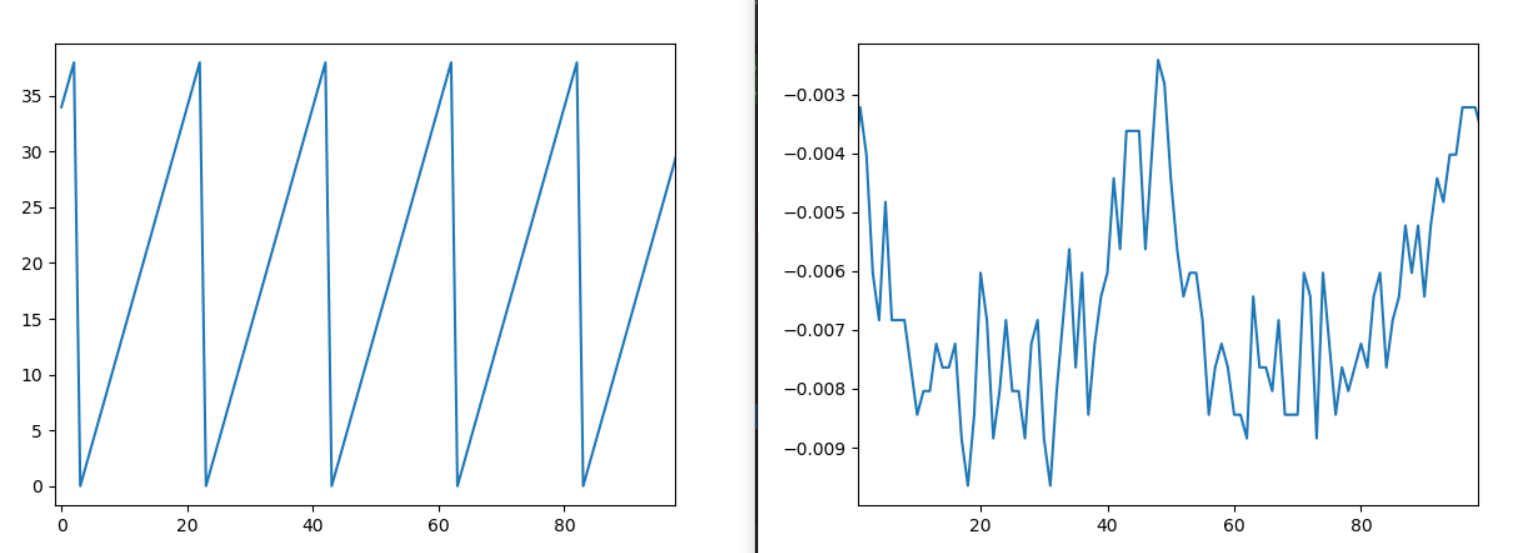
The desired capture configuration is to get 100 samples in total of the following registers, with no trigger:
- commutation angle value
- current A counts
The steps are:
- Disable monitoring if enabled.
- Set the mapping configuration:
- Set monitoring mapped register 0 = 0x10400804 → Register address 0x040 of subnode 1 (commutation angle value), data type FLOAT32 and size 4 bytes.
- Set monitoring mapped register 1 = 0x103D0202 → Register address 0x03D of subnode 1 (current A counts), data type UINT16 and size 2 bytes.
- Set monitoring number mapped registers = 2.
- Read monitoring number of bytes per sample → 6 bytes: 4 bytes from channel 0 and 2 bytes from channel 1.
- Configuration of the number of samples:
- Set monitoring delay = 0 samples.
- Set monitoring buffer size = 100 samples.
- Trigger configuration:
- Set monitoring trigger type = 0 (Auto, no trigger).
- Enable monitoring.
At this point the data is being captured. Application has to wait checking the monitoring status to see when the monitoring data acquisition is completed. Then:
- Read actual number of monitoring samples → Check that the recorder monitoring samples is the same as requested, 100.
- Finally read the monitoring data.
The data would be:
Disturbance
Disturbance module is used to inject deterministic data in the system. It works in the same way as monitoring but in the opposite direction. Disturbance has 2 stages:
- Disturbance configuration and data transfer: This stage configures the disturbance module and loads the desired signals in the mapped channels.
- Disturbance injection: In this stage disturbance is applied, data is injected periodically until disturbance module is stopped.
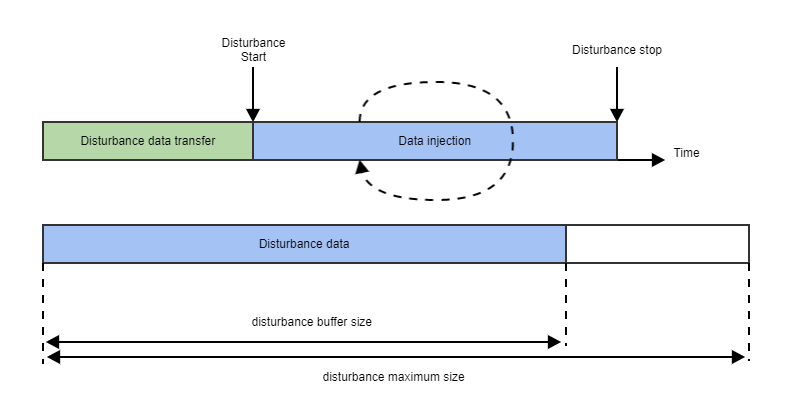
Disturbance maximum size is product dependent.
When computing disturbance buffer size, the maximum number of samples will depend on disturbance maximum size, the number of disturbance channels and the size of each channel:
Control and status
The disturbance states are:
| Disturbance states |
|---|
| Init stage |
| Data injection |
| End stage |
Disturbance workflow can be controlled with the following registers:
Enable disturbance: Enables and disables disturbance.
- Disturbance status: This register allows knowing the disturbance status, which contains information about:
- If the disturbance is actually enabled.
- The state of the disturbance process.
- Other useful information
Disturbance module workflow may be attached to monitoring, or not. This depends on the product. In order to check it, the information is held in register monitoring disturbance version.
If the monitoring and disturbance workflow is attached, this means that when one of the directions is enabled, the other direction will be enabled at the same time, so both directions will work together.
Sampling time
Disturbance module base frequency is the same as monitoring, it is executed at the same rate of the position and velocity control loops. The disturbance sampling frequency is adjusted with the disturbance frequency divider register. This register is a divisor of the position and velocity loop rate (like a prescaler), and this base frequency can be read with the position & velocity loop rate register.
The stability of the position & velocity control loops reference is not guaranteed for all the products. For products based on the EVE family and dual-core Summit architecture, the inter-processor communications may not be fast enough to set all the mapped disturbance variables in 1 cycle.
Desired channels - mapping process
The disturbance module needs to know which channels have to be injected before starting the process.
Not all registers can be mapped, only the registers PDO mappable can be used.
The disturbance mapping is exactly the same as already explained in the monitoring section, but using registers disturbance mapped register N (N from 0 to 15) and disturbance number mapped registers.
When all the disturbance configuration steps are complete, the disturbance data can be sent to the drive writing register disturbance data.