Scope
The Digital Scope allows the user to optimize system performance using data collection. It works in two different modes: collecting data continuously from the servo drive (Polling) or monitoring and gathering a fixed amount of points (Monitoring). Depending on system performance, one or the other will be more appropriate and accurate to collect data.
The two modes allow to select multiple signals and assign different colors or primary/ secondary Y axis for better values visibility. Also In both modes the collected plots can be exported to a CSV file through the EXPORT button.
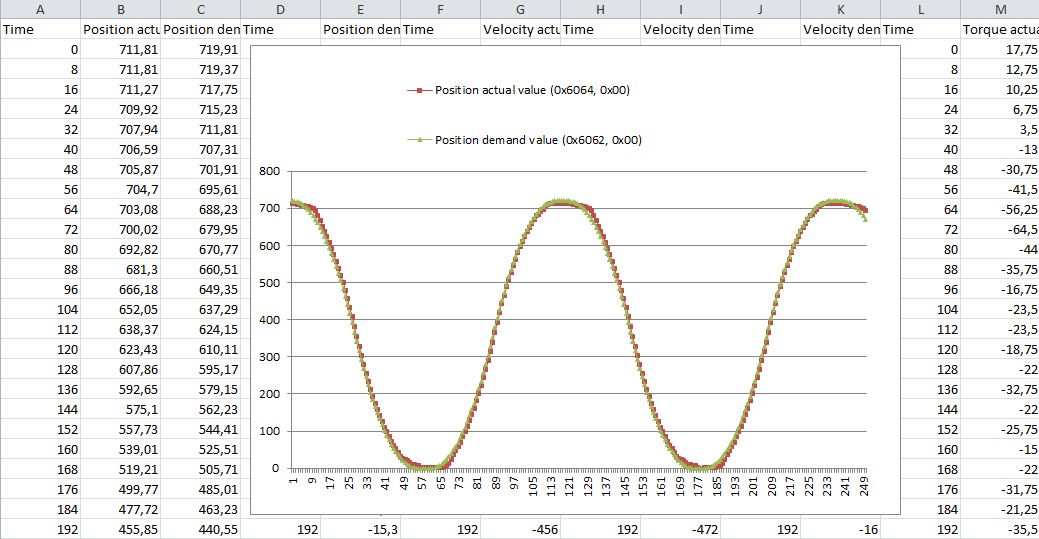
Notice that in polling mode only the enabled signal is exported while in monitoring mode all the signals are exported regardless of the number that are enabled:
When adding a channel, together with the Name, Units, Color and Chart, you will find the internal register associated with it (Index and SubIndex). These registers follow the CANopen protocol structure since Ingenia Servo Drives are compliant with CANopen standard (CiA-301, CiA-303, CiA-305, CiA-306 and CiA-402).
Functionalities of the scope include:
- Display up to 4 simultaneous charts
- Collect and plot various signals (channels) including position, velocity and position error on multiple axes
- Graphically examine collected data using cursor and zooming tools
- Auto-scale
- Export results to CSV files
Polling Mode
In this mode, the scope collects continuous data from a set of signals previously selected; sample rate can be set up to 50 ms.
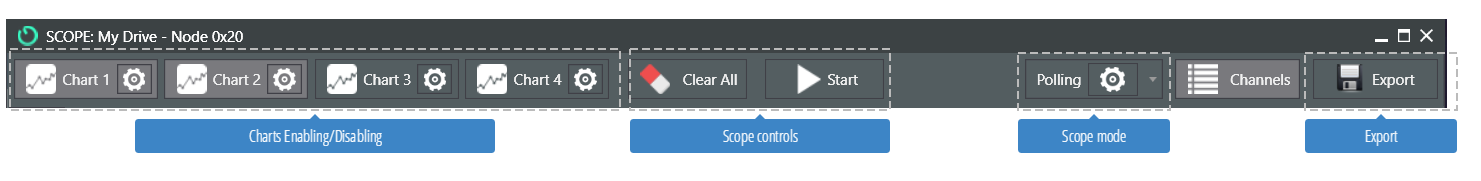
To configure the polling mode click on the gear icon in the Polling selection.
| Parameter | Description |
|---|---|
| Display cursor dot point | Plot a dot for each value |
| Sample rate | Rate in ms at which each data is requested |
| Time scale | Scale used for plotting |
Monitoring Mode
This mode allows a more accurate data collection and analysis. After setting the recording time in ms, it will gather data using as trigger any motion start (future triggers will be available). It collects up to 2500 points and by default plots all the relevant motion signals (demanded and current values) which afterwards can be disabled for individual channel analysis.
To configure the monitoring mode click on the gear icon in the Monitoring selection
| Parameter | Description |
|---|---|
| Display cursor dot point | Plot a dot for each value |
| Trigger mode | Specify the trigger to start collecting data |
| Maximum sample rate | Read only parameter specifying the maximum sampling rate. Based on the time specified, the # of samples/second will be automatically updated |
| Trigger delay | Delay added after trigger |
| Auto-rearm trigger | Enable/Disable auto-rearm trigger. If enabled a pause time (in ms) can be specified. |