
Monitoring is not supported by Everest (EVE) drives through CANopen or CoE communications. Therefore, in order to carry out Electrical Tuning please connect to the drive via Ethernet. The feature is supported on EVS.
This page is not available if trapezoidal commutation is selected.
Introduction
The "Electrical Identification" is the first step to configure and tune the PI controllers for the quadrature and direct current loops of the drive. The main goal is to identify the RL model of the motor connected.
In this document you will see an overview of the two types of identification and how to use them. Also, it provides explanation on what the charts present.
Types of identifications
There are two types of identifications to choose from:
-
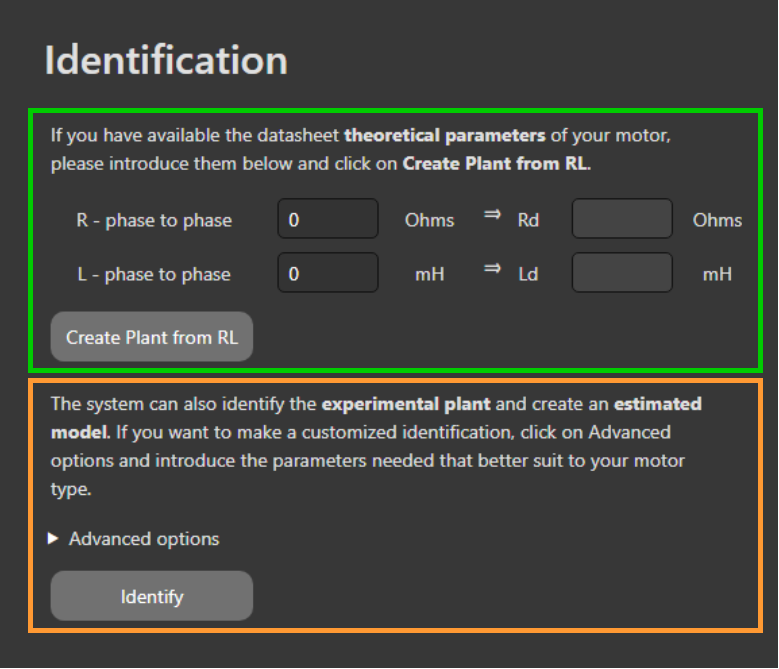
Theoretical identification (green) → The controller can be designed from the theoretical parameters provided in the datasheet of the motor.
-
Automatic identification (orange) → The drive is able to identity the plant on its own. We recommend this option as it provides a more realistic representation of the plant.
If you decide to make an Automatic identification, you can skip the Theoretical identification.
Charts
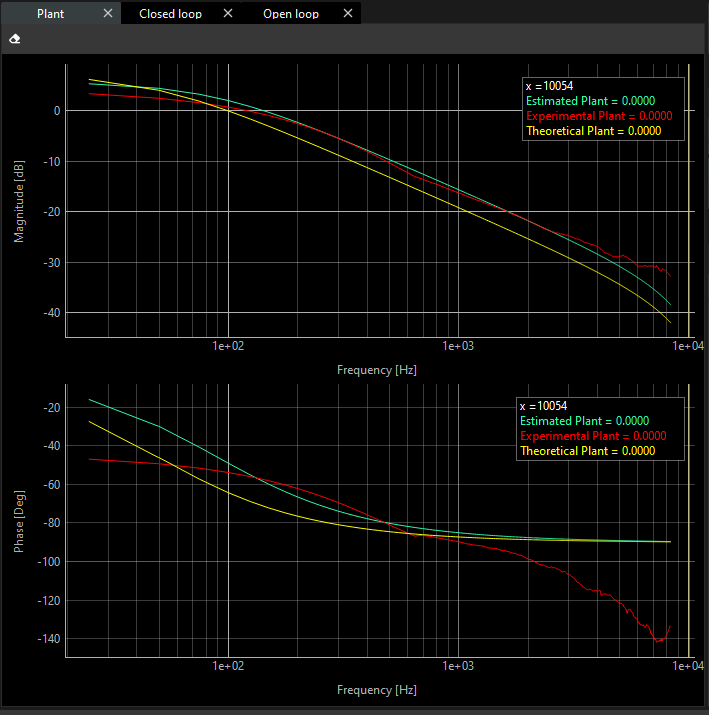
Both identification methods display their measured signals on the scope located in the Plant tab.
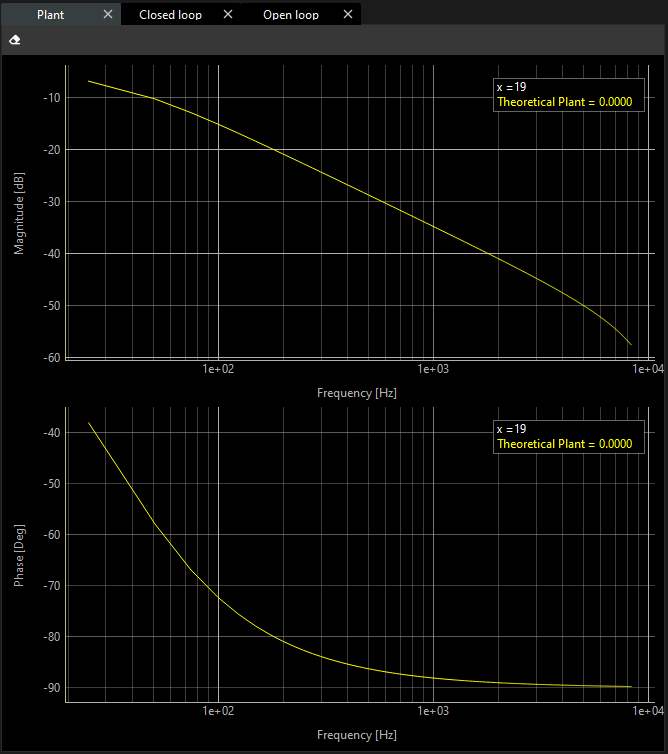
The resulting chart consists of two plots: the gain, expressed in dB, shown in the upper plot, and the phase, expressed in degrees (°), shown in the lower plot. Both quantities are represented in the frequency domain.
Display widget
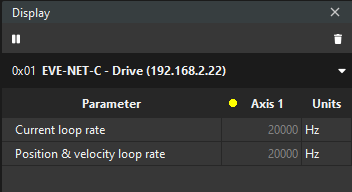
The display widget shows the values of the loop rates.
Control widget
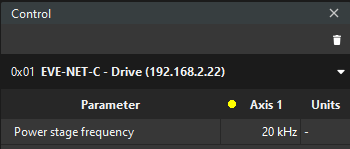
The control widget allows you to change the power stage frequency. The power stage frequency affects on identification especially when comes to low inductance motors. You can find further information, click here
Theoretical identification
-
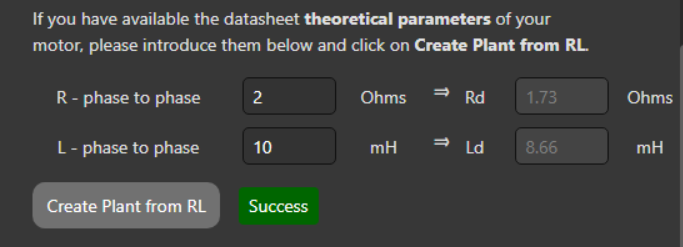
Put the resistance and inductance phase to phase, as presented in the datasheet of the motor.
-
Click on the “Create Plant from RL”.
-
Make sure that the test is passed successfully.
-
If the plant is created successfully, the equivalent resistance and inductance in the direct-quadrature frame values will be displayed.
-
The theoretical plots in the magnitude and phase charts in the frequency domain are presented based on the theoretical inductance and resistance.
-
In addition, you will notice the Terminal shows some information. This information includes:
-
Direct and quadrature resistances: Rd, Rq
-
Direct and quadrature impedances: Ld, Lq
-
The transfer function that plots comes from.
-
And some additional information about Gain and Phase margins.
-

Automatic identification (recommended)
-
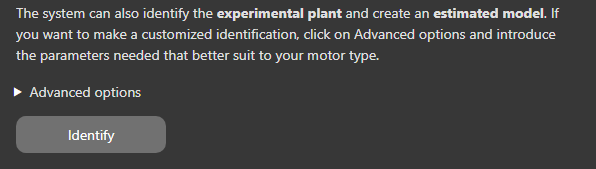
In order to do an automatic identification, click on the Identify button.
-
The result of the identification is displayed next to the Identify button. If the identification is successful, you can proceed with the tuning process. If the identification fails, recommendations to improve the identification procedure will be displayed in the terminal. These may include suggestions such as increasing the switching frequency or adjusting other test parameters.
-
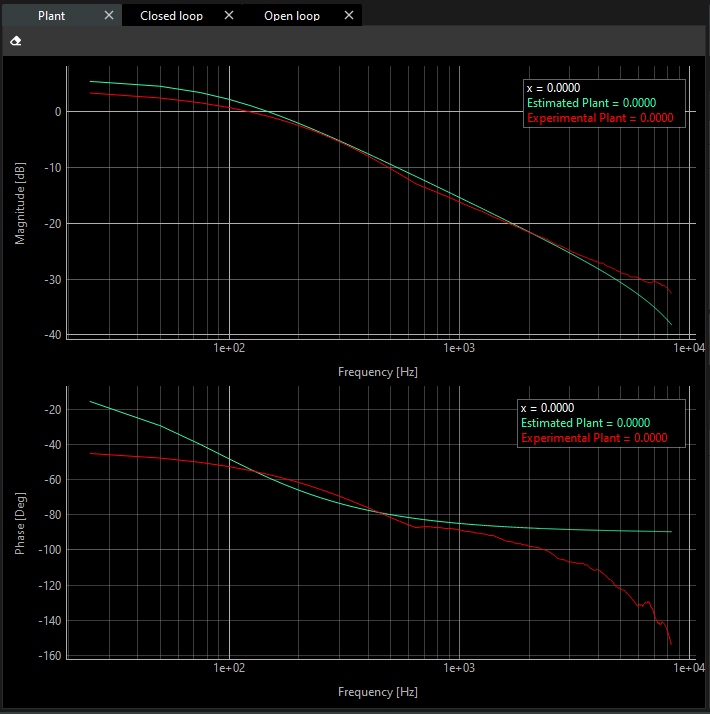
Two curves are displayed on the gain and phase plots. Their meaning is as follows:
-
Red curve: Represents the experimentally measured frequency response of the actual system.
-
Green curve: Represents the estimated plant model. Using the experimentally identified motor resistance and inductance values, a transfer function is derived to provide the best possible fit to the measured frequency response of the system.
Comparing these two curves provides an indication of how accurately the estimated plant model matches the real system behavior. A closer overlap between the estimated and measured responses indicates a more accurate identification result.
-
-
In the terminal window, you can find the following information:
-
The quality of the identification.
-
The Transfer Function.
-
Phase and Gain Margins.
-
-
In some very specific applications, the change of the excitation parameters of the applied multisinus injection might be required. This can be done through the Advanced Options section.
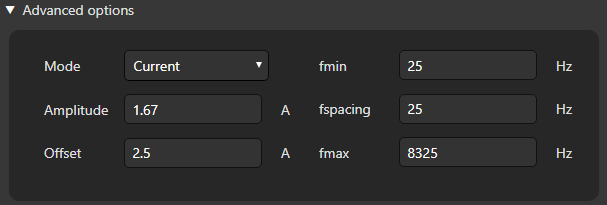
You can configure this signal with these options.
-
Mode:
-
Current: The amplitude and offset below define the current values expected during the identification. An additional Resistance estimation step is performed to calculate the voltage excitation needed. This is the default mode, since it allows a better control of the current flow during identification and reduces the risk of overcurrent.
-
Voltage: The amplitude and offset below define the voltage excitation used for the identification.
-
-
Amplitude: The Amplitude of the excitation signal
-
In current mode, in Amperes.
-
In voltage mode, in Volts.
-
-
Offset: An offset to the excitation is recommended to have an always positive excitation and avoid changes in the magnetic field direction of the motor.
-
In current mode, in Amperes.
-
In voltage mode, in Volts.
-
-
fmin: The minimum frequency used for the identification.
-
fspacing: The resolution of the frequency.
-
fmax: The maximum frequency.
-
-
Once you are satisfied that the identified plant model accurately represents the system behavior (typically when the estimated response closely matches the measured response) you can proceed to the next step.